market data走势:
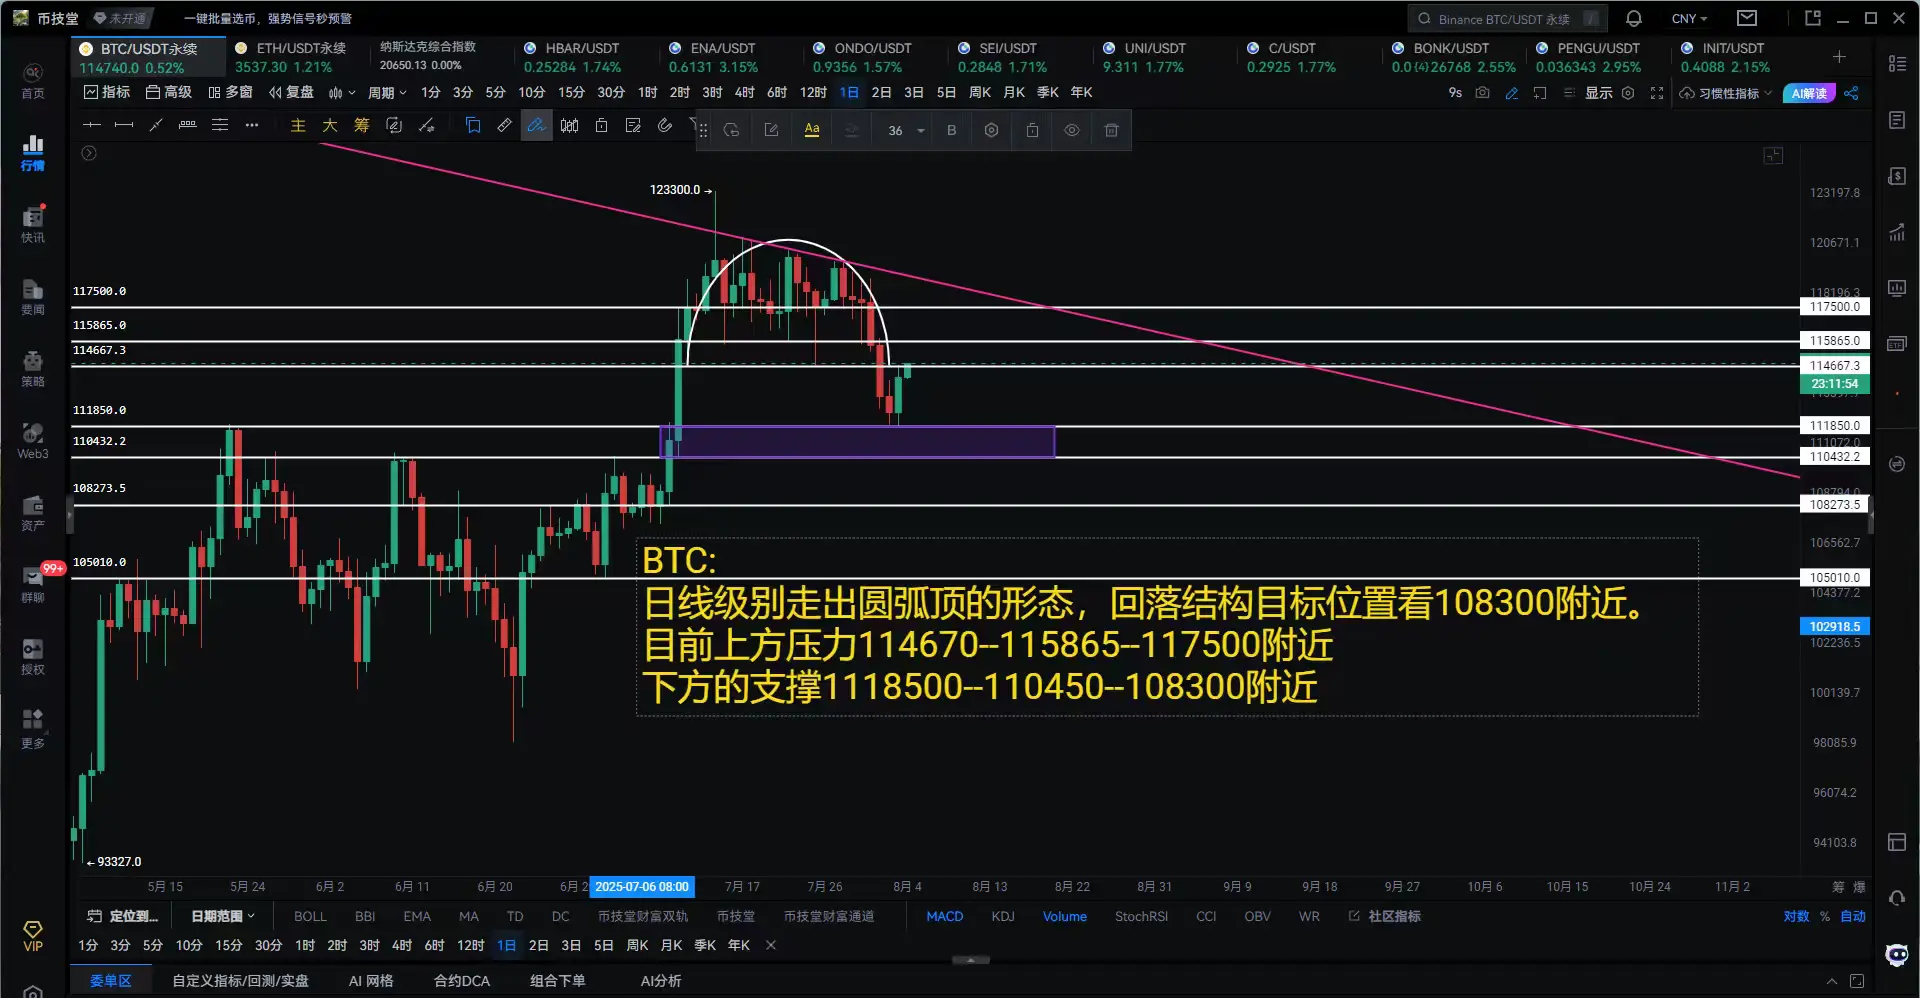
The daily chart for Bitcoin is currently showing a rebound. The MACD is supported near the zero axis and is correcting. The main chart is currently facing resistance at the 115,700 level above. If it breaks through and does not adjust above, and does not break the short-term trading line, then the MACD smoothing will generally trend upward, making it easy to reach the previous high. As long as the daily chart does not break this recent low of the pullback, the weekly chart should not have major issues. However, if it breaks the weekly chart and cannot recover, then the
View Original